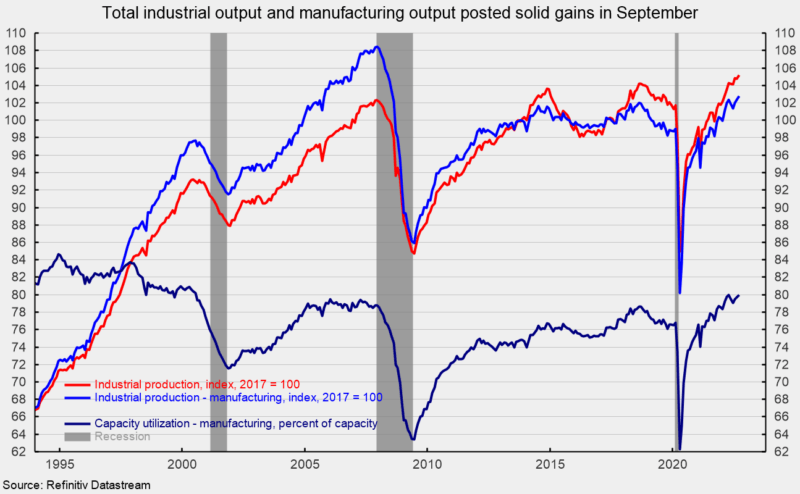
Total industrial production increased 0.4 percent in September to a record high after decreasing 0.1 percent in August. Total industrial production is up in six of the last nine months. Over the past year, total industrial output is up 5.3 percent (see first chart).
Total industrial capacity utilization increased 0.2 points to 80.3 percent from 80.1 percent in August. September matched the highest level since March 2008 and is above the long-term (1972 through 2021) average of 79.6 percent, but well below the highs of the 1970s when it was above 88 percent.
Manufacturing output – about 74 percent of total output – posted a solid 0.4 percent gain for the month, the third consecutive increase and sixth in the last eight months (see first chart). From a year ago, manufacturing output is up 4.7 percent. The 12-month gains for total industrial and manufacturing output are well above their 40-year annualized growth rate of 2.0 percent.
Manufacturing utilization rose 0.3 percentage points to 80.0 percent, above its long-term average of 78.2 percent. However, it remains well below the 1994-95 high of 84.7 percent.
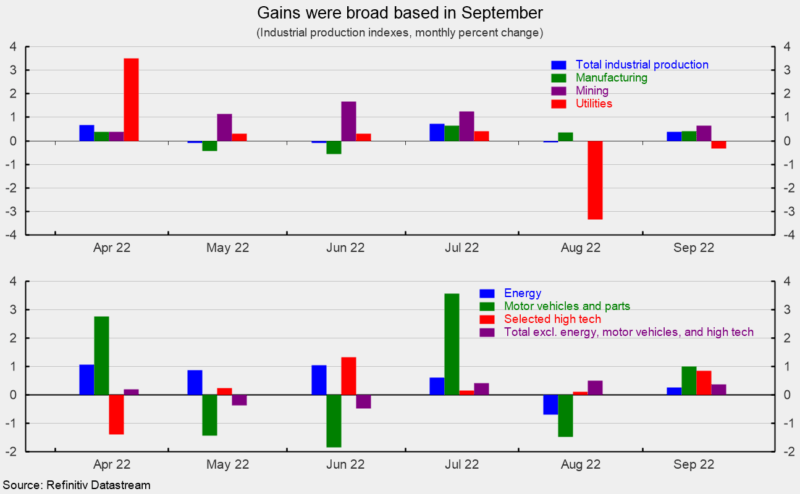
Mining output accounts for about 16 percent of total industrial output and rose 0.6 percent last month (see top of second chart). Over the last 12 months, mining output is up a very robust 11.1 percent.
Utility output, typically related to weather patterns and about 10 percent of total industrial output, fell 0.3 percent, with natural gas up 1.1 percent but electric down 0.6 percent. From a year ago, utility output is up 0.5 percent.
Among the key segments of industrial output, energy production (about 27 percent of total output) rose 0.3 percent for the month (see bottom of second chart) with gains in oil and gas well drilling (up 1.0 percent), consumer energy products (up 0.9 percent), converted energy products (up 0.4 percent), and primary energy production (up 0.1 percent) more than offsetting a drop of 0.5 percent in commercial energy products. Total energy production is up 7.0 percent from a year ago.
Motor-vehicle and parts production (about 5 percent of total output) jumped 1.0 percent after a 1.5 percent decline in August and a surge of 3.6 percent in July (see bottom of second chart). From a year ago, vehicle and parts production is up 19.4 percent.
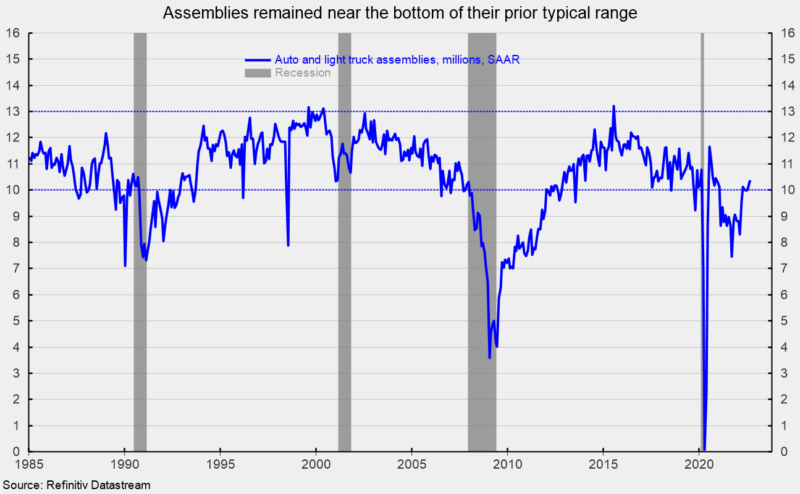
Total vehicle assemblies rose to 10.65 million at a seasonally-adjusted annual rate. That consists of 10.31 million light vehicles, the highest since December 2020 (see third chart), and 0.34 million heavy trucks. Within light vehicles, light trucks were 8.57 million while cars were 1.75 million. Assemblies have risen sharply from the lows but remained at the bottom of their typical prior range.
The selected high-tech industries index gained 0.8 percent in September (see bottom of second chart) and is up 4.9 percent versus a year ago. High-tech industries account for just 2.1 percent of total industrial output.
All other industries combined (total excluding energy, high-tech, and motor vehicles; about 66 percent of total industrial output) rose 0.4 in September (see bottom of second chart). This important category is 3.6 percent above September 2021.
Overall, industrial output posted a solid gain in September, hitting a record high. Manufacturing output also rose on widespread increases. While most measures of economic activity suggest the economy continues to expand, elevated price increases, weak consumer sentiment, an aggressive Fed tightening cycle, and fallout from the Russian invasion of Ukraine remain significant threats to the economic outlook. Caution is warranted.
* This article was originally published here
PUBLISH WITH US!
The Washington Gazette works at our discretion with businesses, non-profits, and other organizations. We do not work with socialists, crony capitalists, or disinformation groups. Click the green button below to view our services!
HELP STOP THE SPREAD OF FAKE NEWS!
SHARE our articles and like our Facebook page and follow us on Twitter!


0 Comments