Due to the collapse of totalitarianism and the concomitant rise of economic freedom in the twentieth century, the rate of human progress became so rapid that paternalists and others bent on augmenting their own political power had to begin concocting crises to justify their preferred policy prescriptions.
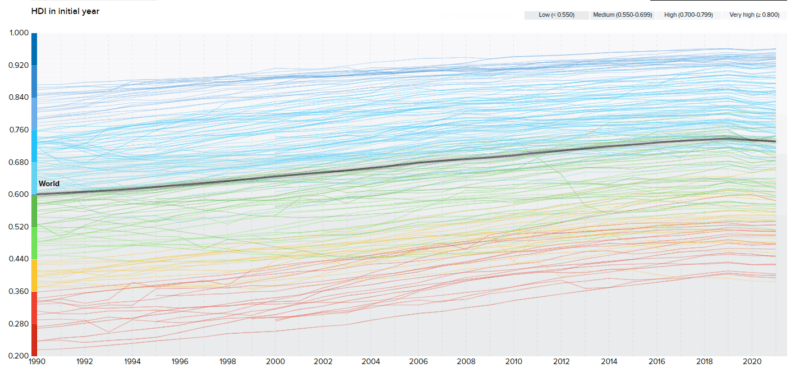
Here is what the UN’s Human Development Index looks like over the last three decades. Each line represents a country. While a few (Somalia, Syria, Venezuela, Zimbabwe, etc.) collapsed, many others saw steady-to-amazing gains, leading to a clear annual increase in the world average until 2020.

The mostly likely cause? Economic freedom. The percentage of countries rated as “free” by Freedom House increased from 25 in 1975 to 46 by the late 2000s, while the percent rated “not free” decreased from 41 to just 22 over that same span. (Those rated “partially free” hovered around 30 percent throughout.) Right on cue, though, the percentage rated “free” began to wane in 2020, while in that same year the percentage rated “not free” exceeded 28 percent for the first time since 1994.
Steady increases in freedom and human development was great news, right? Not for those who abhor classical liberalism and abjure limited government. The last three decades proved that there was literally nothing for politicians and policymakers to do but to continue to relinquish power, or to find crises to exploit. Many chose the latter and became bearish on humanity.
I’m reminded of the description of those with short interests in securities traded on the Dutch stock market in the 17th century as described by Jose de la Vega in his aptly entitled 1688 tract Confusion de Confusiones:

In the telling of the bears, every bad thing that has happened in the last few decades portended doom. A handful of fanatics living in caves 10,000 miles away became an existential threat because they got lucky in an attack that could never be repeated. Another slightly closer fanatic was said to possess yellow cake uranium when he only had yellow toilets (made from gold). Every storm or drought became evidence for cataclysmic climate change.
In 2008, the bears said that the near failure of a few big banks threatened to obliterate the economy and everyone’s jobs along with it, although the sums paid to bail them out instead could have funded ample unemployment benefits for everyone put out of work by a downturn, and done so without creating massive moral hazard and hence sowing the seeds of future financial crises.
Not even a decade later, a POTUS with an unusual communication style spelled the end of “our democracy,” the bears growled. And when a new but hardly “novel” coronavirus began to spread throughout the globe, bearish public health officials conflated case fatality rates with infection fatality rates, thus sowing panic and confusion that only they could alleviate.
While all of that was going on, policy bears were also creating the illusion that income and wealth inequalities were soaring in America. Turns out, though, they weren’t. AIER research director Phil Magness and coauthors have proven that widely cited data published by three scholarly permabears led by Tomas Piketty was wrong. Income inequality did not dip to low levels in the mid-twentieth century only to roar back in recent decades. In fact, income inequality barely changed at all over the last century.
But even if income inequality had followed Piketty’s U-curve, average incomes have grown so strongly over the last century that it would not matter to anyone, presuming the situation was framed correctly. Would you rather make $10,000 a year when your neighbor makes $20,000, or would you rather make $100,000 when your neighbor makes $1,000,000?
Along with flawed income inequality statistics, policy bears have been pushing the notion of a crisis in socioeconomic mobility. The claim is that Americans born poor are likely to remain poor, while those born rich will most likely die rich. The campaign was effective as a 2019 study in PNAS showed that Americans overestimate the intergenerational persistence in income ranks. In other words, “they overestimate economic prospects for children from rich families and underestimate economic prospects for those from poor families.”
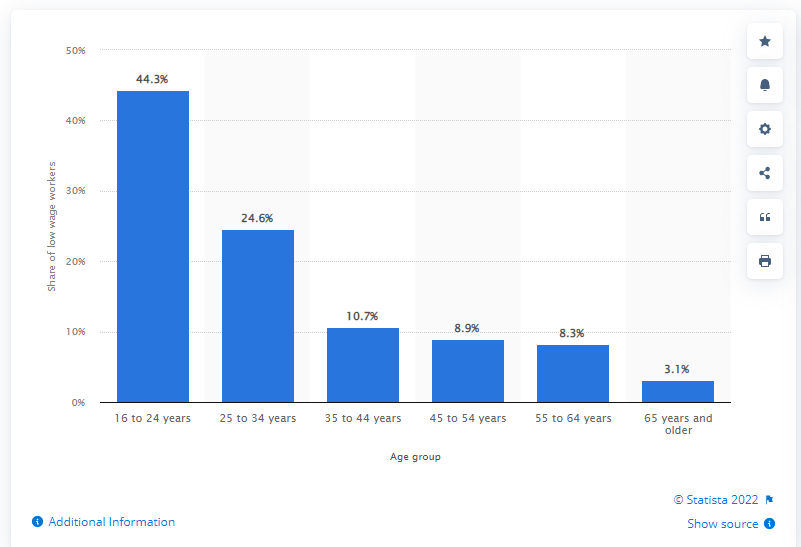
Admittedly, anecdotal evidence based on informal polling of college students also suggests that most Americans support a higher federal minimum wage because they grossly overestimate the percentage and age of the workers who earn the minimum wage. Many think that minimum wage workers are older and trying to support families, when in fact about two-thirds are 24 years old or younger.
Percentage of Minimum Wage Hourly Workers in the U.S. in 2021 by Age

All told, minimum wage workers (which in government statistics include those who earn hourly wages and tips greater than the minimum wage) constitute less than 2 percent of the workforce paid an hourly wage. Similar data for states with minimum wage laws exceeding the federal level proved difficult to find. They are undoubtedly higher but nowhere near the level many Americans assume given frequent dire accounts of the “American Dream in crisis.”
Of course none of this is to argue that the country or world is perfect and we should all sleep easy. But the most dire crisis of all may very well be the ability of those seeking to usurp power to create the appearance of crisis from mere bat viruses, lucky strikes, and statistical shadows.
* This article was originally published here
PUBLISH WITH US!
The Washington Gazette works at our discretion with businesses, non-profits, and other organizations. We do not work with socialists, crony capitalists, or disinformation groups. Click the green button below to view our services!
HELP STOP THE SPREAD OF FAKE NEWS!
SHARE our articles and like our Facebook page and follow us on Twitter!


0 Comments