The Federal Reserve has announced that it intends to raise inflation in the United States to two percent per year on average. Inflation generally has been less than two percent in recent years. Is the Federal Reserve likely to be successful at hitting this new target or even exceeding it? Recent dramatic increases in the money supply make higher inflation more than likely. It is not so clear that it will average only two percent.
Figure 1

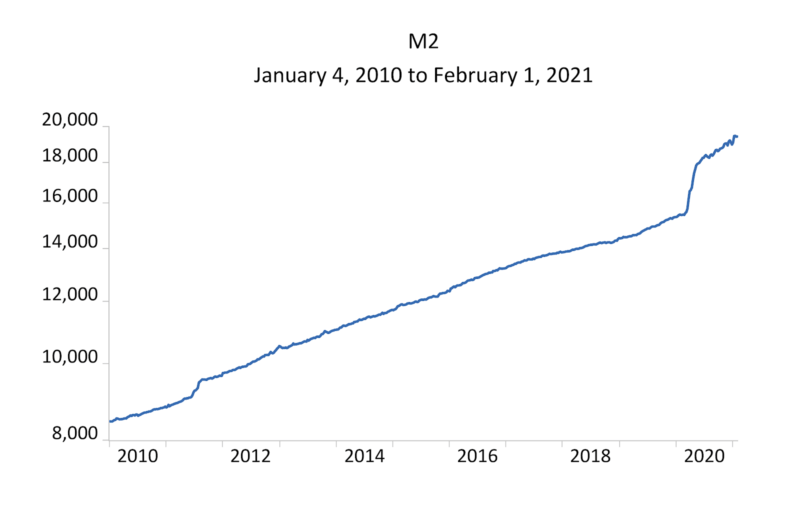
The increase in 2020 in the nominal quantity of money held by firms and households has not been reversed and there is no reason to expect that to happen. Figure 1 shows the level of M2, a broad measure of the money stock. The dramatic recent increase in M2 is evident and its unusual size is equally evident when compared to a longer period. (Another measure of the money stock, MZM, shows a similar increase. The familiar narrow money stock, M1, showed a large increase as well but the Federal Reserve has introduced a substantial discontinuity in available data by redefining it.)
From March 1, 2020, just before the lockdowns and subsequent stimulus payments, the level of M2 increased 16 percent by June. By February 1, 2021, the level of M2 had increased 25 percent. The stimulus payments passed in the most recent stimulus bill most likely will swell M2 even further when the government deposits funds in people’s checking accounts.
It is well known that the effects of such an exogenous increase in the money stock will not appear instantaneously. It takes time for people to adjust to the higher money balances by attempting to buy goods and services.
Still, almost a year into this grand experiment, is there evidence of inflation increasing? There is no reason to expect inflation to be dramatically higher in the near term, although it will increase and be higher for some time. There also is no reason to expect unequivocal evidence everywhere but, if inflation will be increasing, there should be some corroborative evidence.
The last couple of months provide a little bit of evidence of higher inflation, although inflation has been quite variable. The Federal Reserve uses the Personal Consumption Expenditure Price Index without relatively volatile food and energy prices. This index showed an annualized inflation rate of over three percent per year in December and January, the latest month available. On the other hand, inflation was near zero in October and November. Recent data do not provide much of an indication of higher inflation. On the other hand, they provide no evidence to the contrary that inflation will decrease.
Expectations of inflation have increased. Federal Reserve Board members and Bank Presidents now expect higher inflation than they did even in December 2020. After the FOMC meeting March 17, 2021, the Federal Reserve issued its Summary of Economic Projections, which showed that the median FOMC members’ expected increase in the Personal Consumer Expenditure price index for 2021 increased from 1.8 percent per year in December to 2.4 percent and from 1.8 percent to 2.2 percent for the core price index.
Figure 2

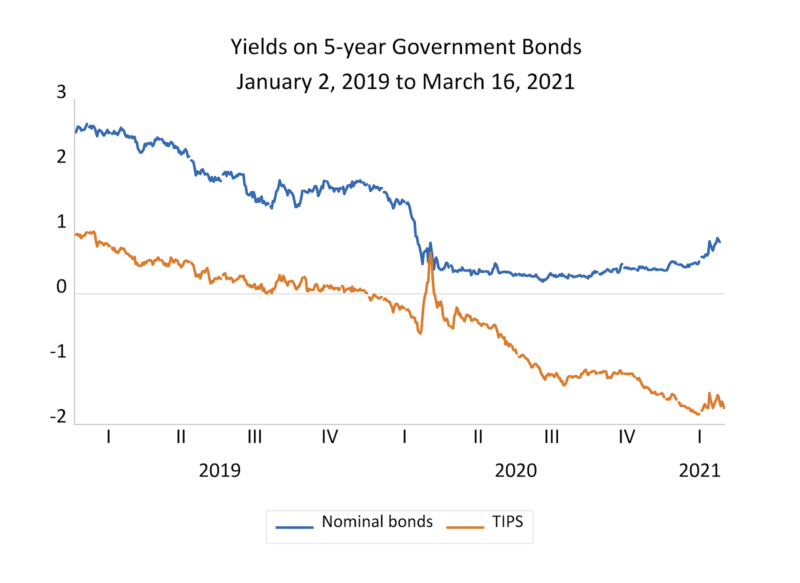
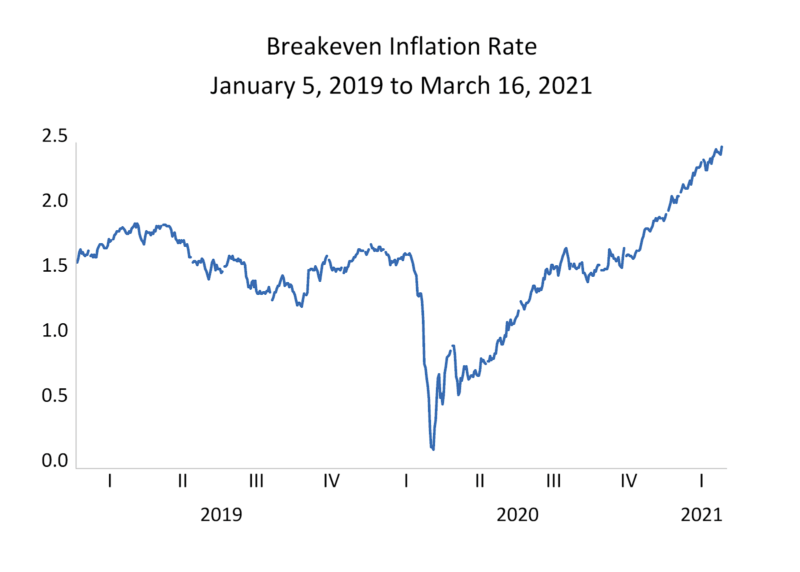
The Treasury bond market provides evidence that private expectations of inflation have increased as well. Figure 2 shows the yields to maturity of 5-year government bonds from January 4, 2019 to March 10, 2021. The nominal Treasury bonds typically discussed promise to pay fixed nominal amounts independent of the inflation rate. They include compensation for expected inflation as a result of ex-ante bids and asks, but are not adjusted for actual inflation ex-post. The Treasury also issues inflation-adjusted bonds, called Treasury Inflation Protected Securities (TIPS). The payments on TIPS are adjusted for actual inflation as it occurs and therefore the market yields of the bonds do not reflect these after-the-fact adjustments. The break even inflation rate, depicted in Figure 3, is the difference between the two. It serves as a rough measure of expected inflation over the bond’s term.
Figure 3

The break-even inflation rate has increased. On March 10, the break even inflation rate in Figure 3 was 2.47 percent. This is similar to the median estimate by FOMC officials but it is for five years, not just one. The forecasts in the Federal Reserve’s Summary of Economic Projections suggest a decline in inflation in 2022 and 2023, a view apparently not shared by participants in bond markets.
Is inflation likely to be only on the order of 2.5 percent for the next five years? Bond markets did not do a good job of reflecting inflation, persistently underpredicting it, in the inflation of the 1960s and 1970s. This low indicator is not necessarily a reason to predict so little inflation.
Figure 4

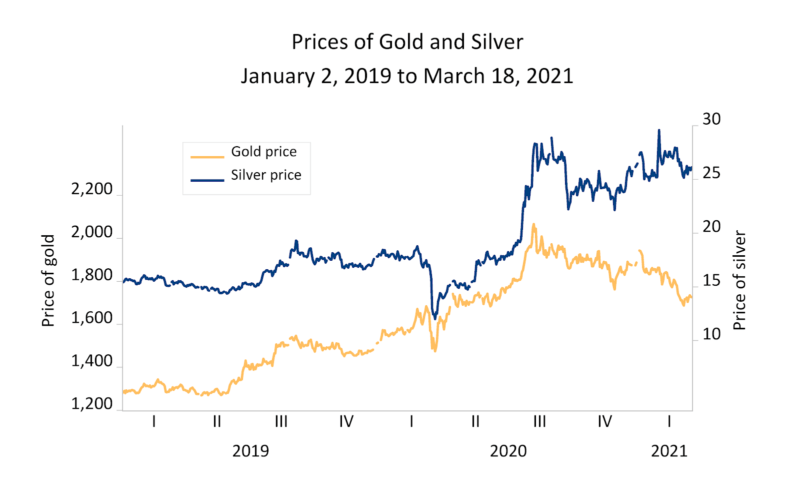
Are there other signs of coming inflation? Classic places to look for signs of inflation are gold and silver prices. Figure 4 shows the prices for gold and silver from January 2, 2019 to March 18, 2021. Their prices have risen, although the increase is more dramatic for silver. Since the start of 2020, gold’s price has increased 13 percent and silver’s price has increased 46 percent. Their prices change for many reasons, but these increases are consistent with inflation increasing.
Prices of other assets also are increasing. Stock prices are increasing but explanations of increases in stock prices are ubiquitous and nailing down an explanation is not easy. Housing prices increased from 9 to 15 percent in 2020, depending on the index. Rising house prices may reflect an increase in the demand for houses relative to other things associated with reactions to lockdowns and temporarily low mortgage rates. They also may reflect a move into real assets that gain from inflation.
There is evidence of increasing inflation. The unresolved question is how high inflation will be for how long.
The increases in money held by the public are a new experiment to test a widely verified proposition: substantial increases in the quantity of money held by the public are associated with substantial inflation. Inflation is quite likely to be higher in coming years than it has been in the recent past. Whether the increase is muted – an increase of one percentage point per year or so – or noticeably larger remains to be seen.
* This article was originally published here
HELP STOP THE SPREAD OF FAKE NEWS!
SHARE our articles and like our Facebook page and follow us on Twitter!


0 Comments