Sales of new single-family homes fell sharply in February, decreasing 18.2 percent to 775,000 at a seasonally-adjusted annual rate from a 948,000 pace in January. Sales are still 8.2 percent above the year ago level (see top of first chart). Sales were down in all four regions of the country in February. From a year ago, sales are up in two regions, the Midwest and the South, but down in the Northeast and the West.
The drop is consistent with the performance of existing single-family home sales. Sales in the market for existing single-family homes, which account for around 90 percent of total existing-home sales, fell 6.6 percent in February, coming in at a 5.52 million seasonally adjusted annual rate. From a year ago, sales are up 8.0 percent. The February pace is the eighth consecutive month above the 5 million mark but is down from a recent peak of 6.01 million in October 2020 (see top of first chart).
Total inventory of new single-family homes for sale rose to 312,000 in February, a gain of 2.6 percent, leaving the months’ supply (inventory times 12 divided by the annual selling rate) at 4.8, up 26.3 percent from January but still 12.7 percent below the year-ago level (see bottom of first chart). Despite the rise in the months’ supply, the median time on the market for a new home declined to 3.2 months from 3.3 in January. This contrasts sharply with the existing single-family market. The total inventory of existing single-family homes was unchanged at 870,000, the lowest on record since tracking began in the mid-1980s. The months’ supply rose to 1.9 from a record low 1.8 in January (see bottom of first chart).
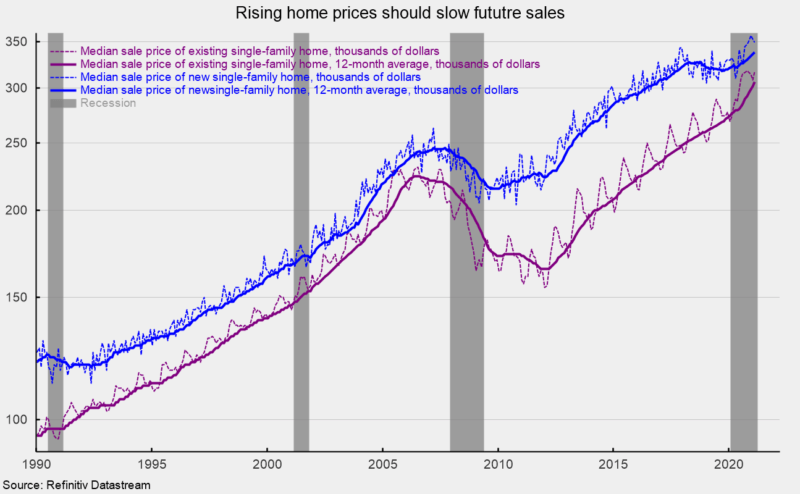
Potential headwinds for the housing market include rising mortgage rates and rising home prices. The median sales price of a new single-family home was $349,400, a rise of 5.3 percent from a year ago. The median sale price in February of an existing single-family existing home was $317,100, a 16.2 percent rise over the past year (see second chart). The sharp gains in home prices are also reflected in other home price measures. The S&P Case Shiller national home-price index is up 10.4 percent from a year ago through December 2020 while the Federal Housing Finance Agency home price index for purchases is up 11.4 percent over the past year through December.
In addition to rapidly rising home prices, rising mortgage rates are likely to weigh on housing activity in coming months and quarters. While mortgage rates are still extremely low by historical comparison, mortgage rates have begun to rise along with yields on 10-year Treasury notes. The spread of mortgage rates over Treasury yields has narrowed recently and if it returns to recent levels, it also suggests mortgage rates are likely to rise further.
The combination of high prices and rising mortgage rates will hurt affordability and likely contribute to slower housing activity in the future, but for now it remains one of the brightest areas of the economy with strong demand, tight supply, and rising prices.
* This article was originally published here
HELP STOP THE SPREAD OF FAKE NEWS!
SHARE our articles and like our Facebook page and follow us on Twitter!


0 Comments