

The recent economic shutdown resulted in record unemployment and left millions of Americans struggling financially. Even as all 50 states have started reopening, the economy has a long road ahead to full recovery.
Housing costs are often the biggest line item for most people’s budgets, and the current economic downturn has made it difficult for many people to pay their mortgages. Americans who own their homes outright are less vulnerable during recessions compared to those households with large mortgages. According to Census Bureau data, over 38 percent of owner-occupied housing units are owned free and clear. For homeowners under age 65, the share of paid-off homes is 26.4 percent.
Mortgage delinquencies tend to rise significantly during recessions. According to quarterly data from the Federal Reserve Bank of New York, the delinquency rate on mortgages peaked at over 8 percent during the Great Recession and declined to below 1 percent in 2019. Data for Q1 2020 shows the start of what’s expected to be a significant increase in mortgage delinquencies this year.
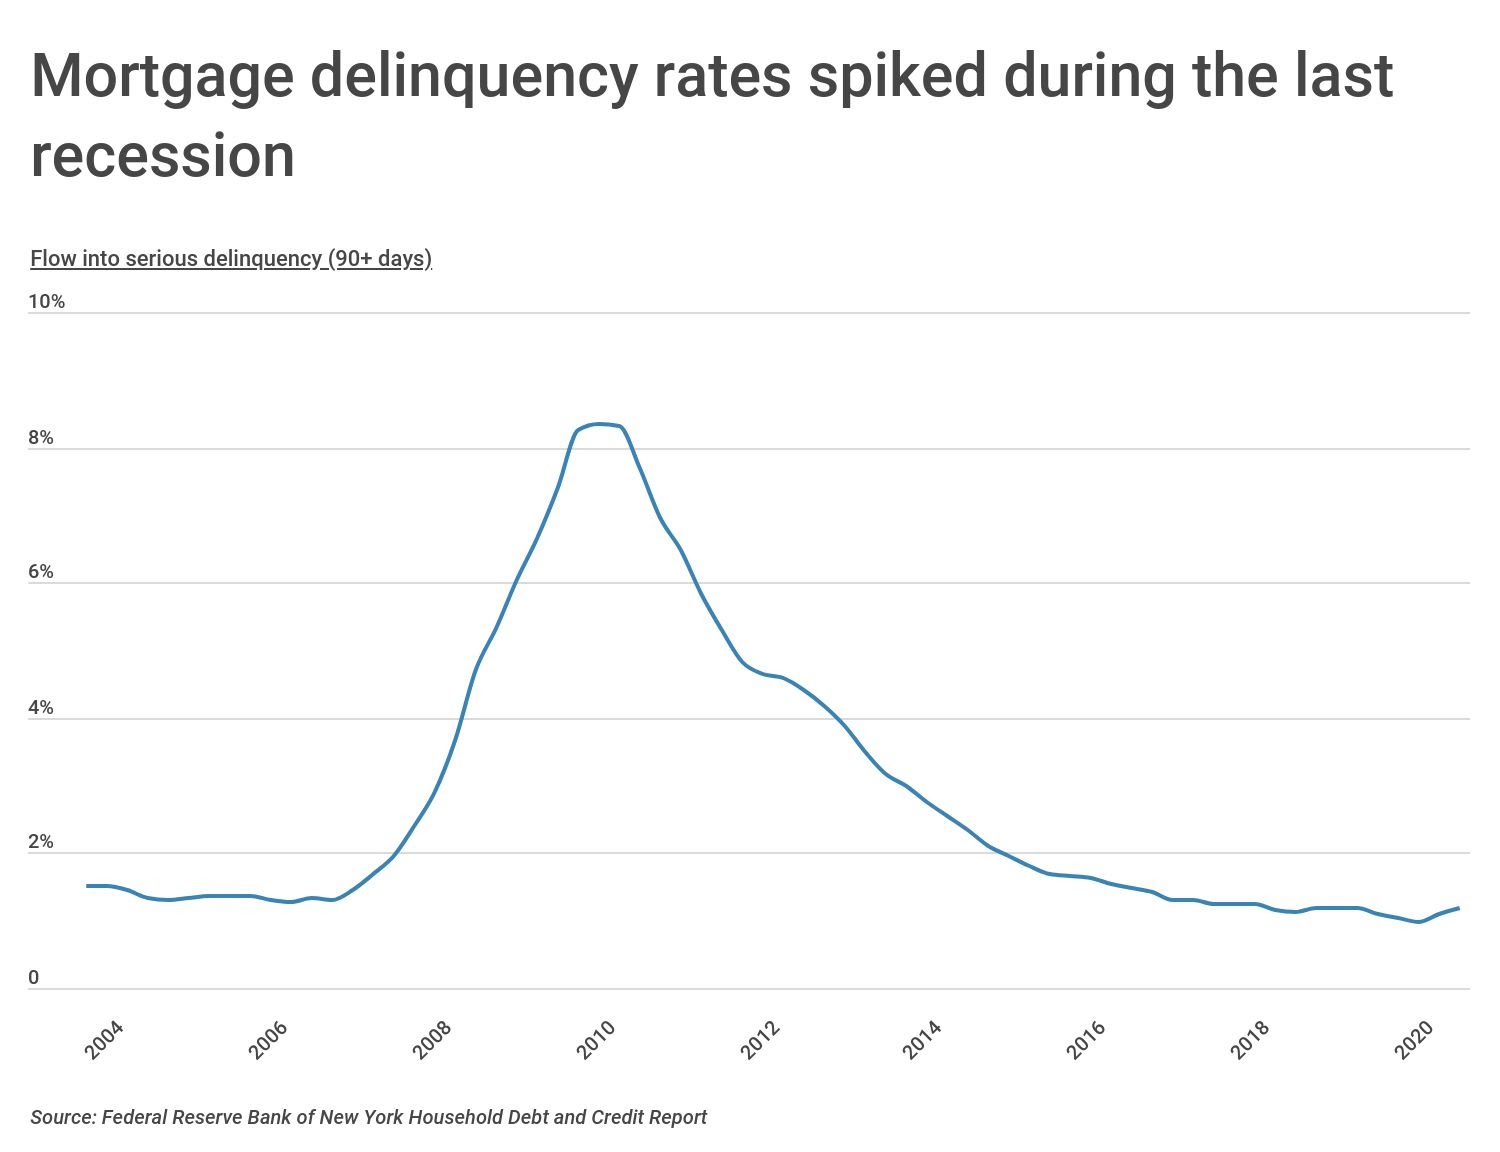
More granular, monthly data from Black Knight, a real estate technology company, indicates that the national delinquency rate nearly doubled between March and April of this year, the largest single-month increase ever recorded.
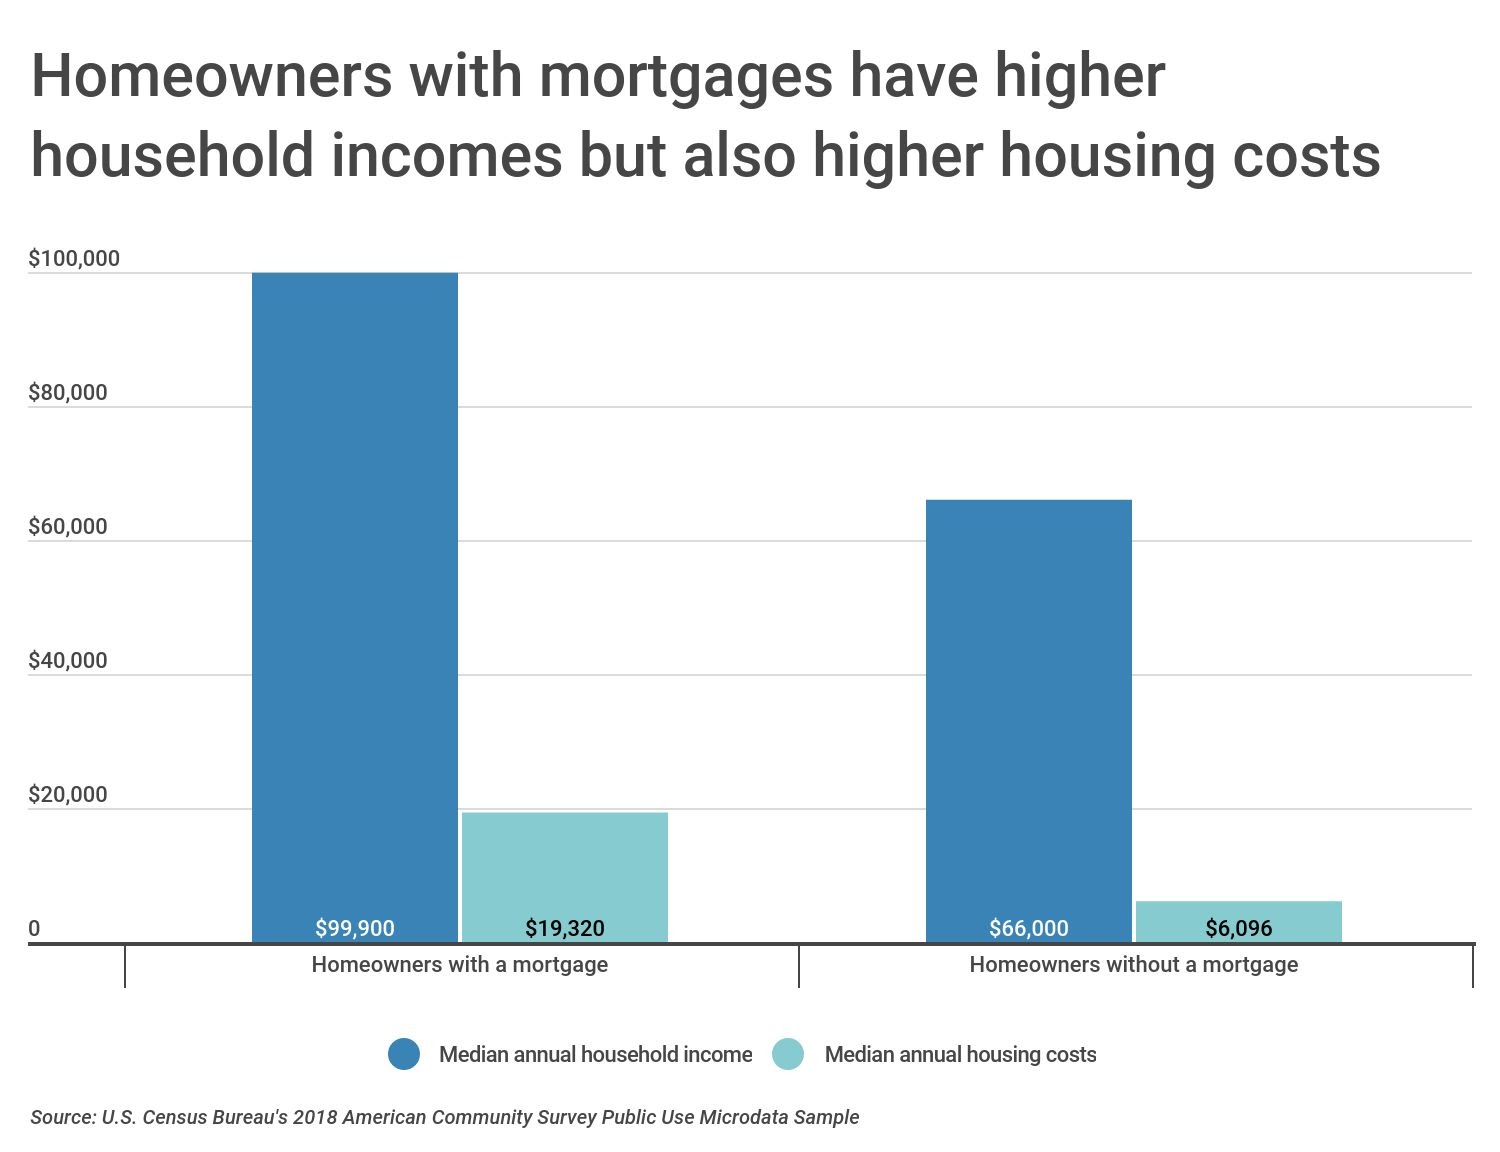
As expected, monthly housing costs between homeowners with and without mortgages differ considerably. Census Bureau data show that the median monthly housing cost – including mortgage payments, insurance, and utilities – for homeowners under age 65 with a mortgage was $1,610 in 2018. This figure was just $508 per month for homeowners under age 65 without a mortgage.
In addition to higher monthly housing costs, homeowners under age 65 with a mortgage tend to have higher household incomes. Among households with a mortgage, the median income is just under $100,000, compared to $66,000 for those households without a mortgage.
Mortgage payoff rates vary substantially across demographic groups. While at the national level, the share of homeowners under age 65 who have paid off their homes is 26.4 percent, certain demographic groups have much higher or lower rates of free and clear homeownership. Being mortgage free is strongly (negatively) correlated with both household income and home value. Higher income households with higher valued homes are less likely to have their mortgages paid off, and many households who have paid off their mortgages live in areas with lower costs of living. Among homeowners with household incomes less than $25,000, 54.5 percent of them have paid off their mortgages.
Comparing age groups, people ages 19 to 25 are more likely to have paid off their mortgages than people ages 26 to 44, but the rates of homeownership among this age group are much lower. The same phenomenon is present when looking at educational attainment among homeowners. People with less than a high school degree are much less likely to be homeowners, but those who do own homes are more likely to be mortgage-free.
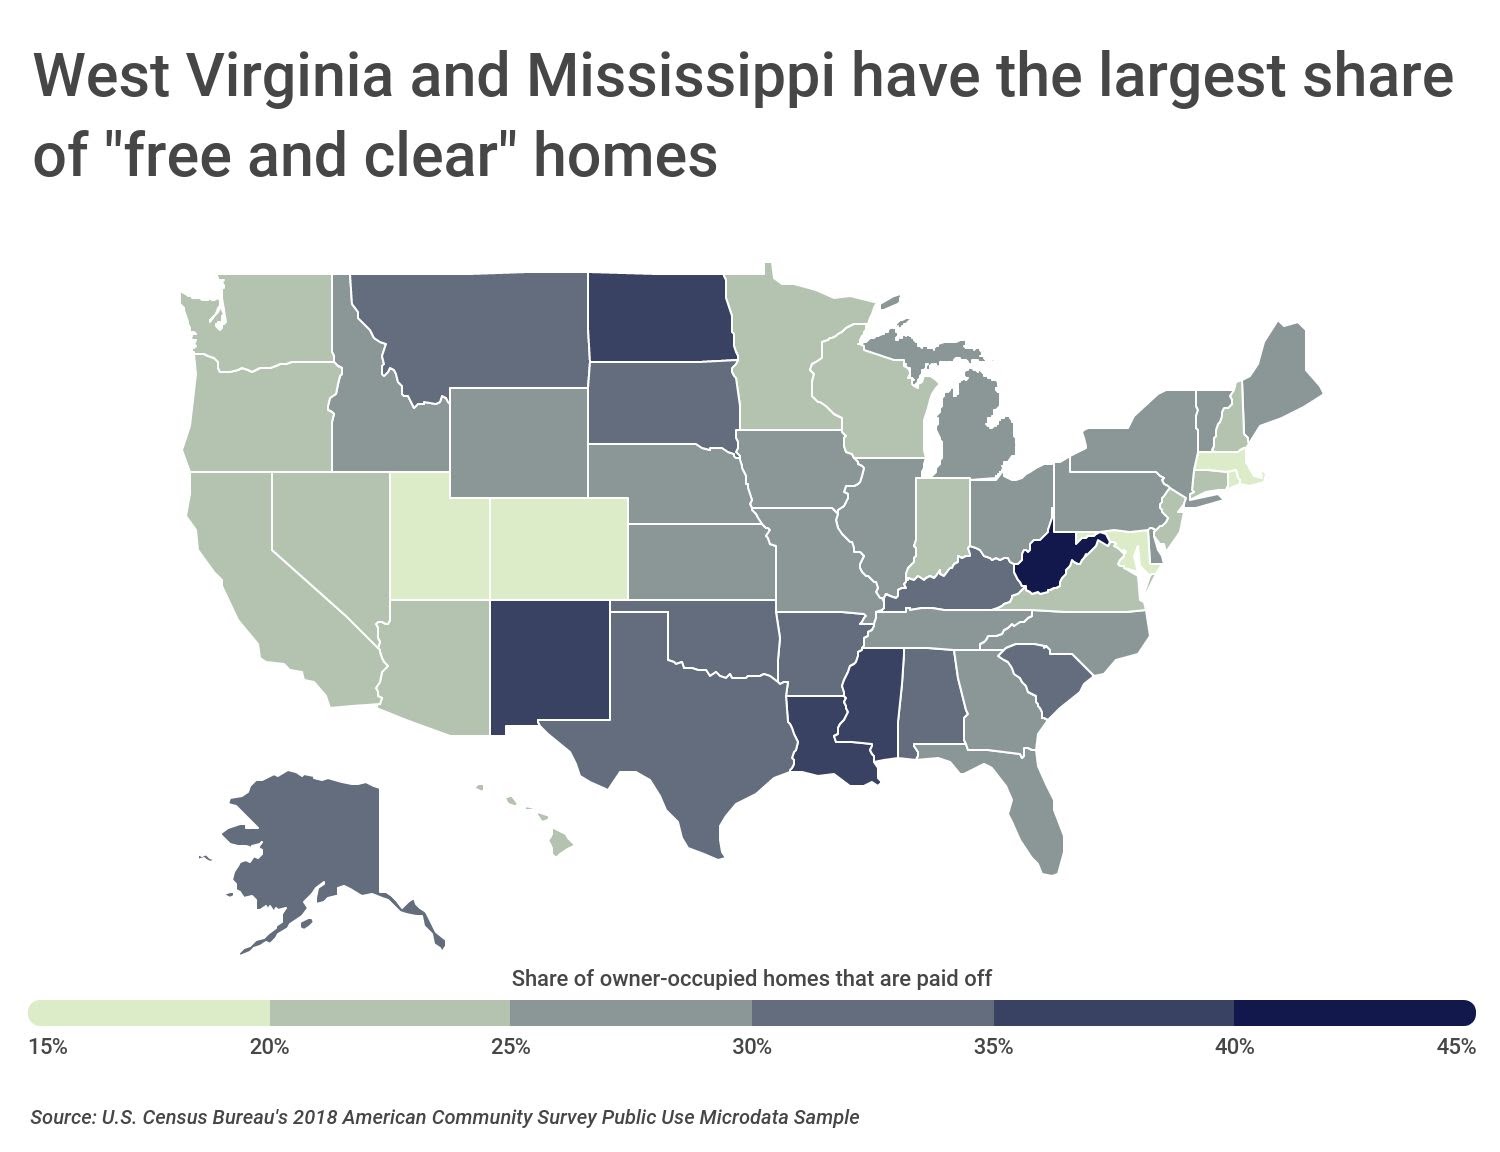
At the state level, West Virginia and Mississippi have the largest rates of free and clear homeownership at 41.3 and 39.4 percent, respectively. Louisiana, North Dakota, and New Mexico also have large percentages of paid-off homes. At the low end, Maryland and Massachusetts have the smallest shares of residents who have paid off their homes, at just 16.6 and 19.2 percent, respectively.
To find the locations with the most residents who have paid off their homes, researchers at Construction Coverage, a review site for HELOCs and builders risk insurance, analyzed the latest data from the U.S. Census Bureau. The researchers ranked metro areas according to the share of owner-occupied homes that are owned free and clear. Researchers also calculated the median home value, median household income, median monthly housing costs, and housing costs as a percentage of income for households with and without a mortgage.
For the purpose of this analysis, only households with homeowners under age 65 were included. To improve relevance, metropolitan areas with fewer than 100,000 people were removed. Additionally, metro areas were grouped into the following cohorts based on population size:
- Small metros: 100,000-349,999
- Midsize metros: 350,000-999,999
- Large metros: 1,000,000 or more
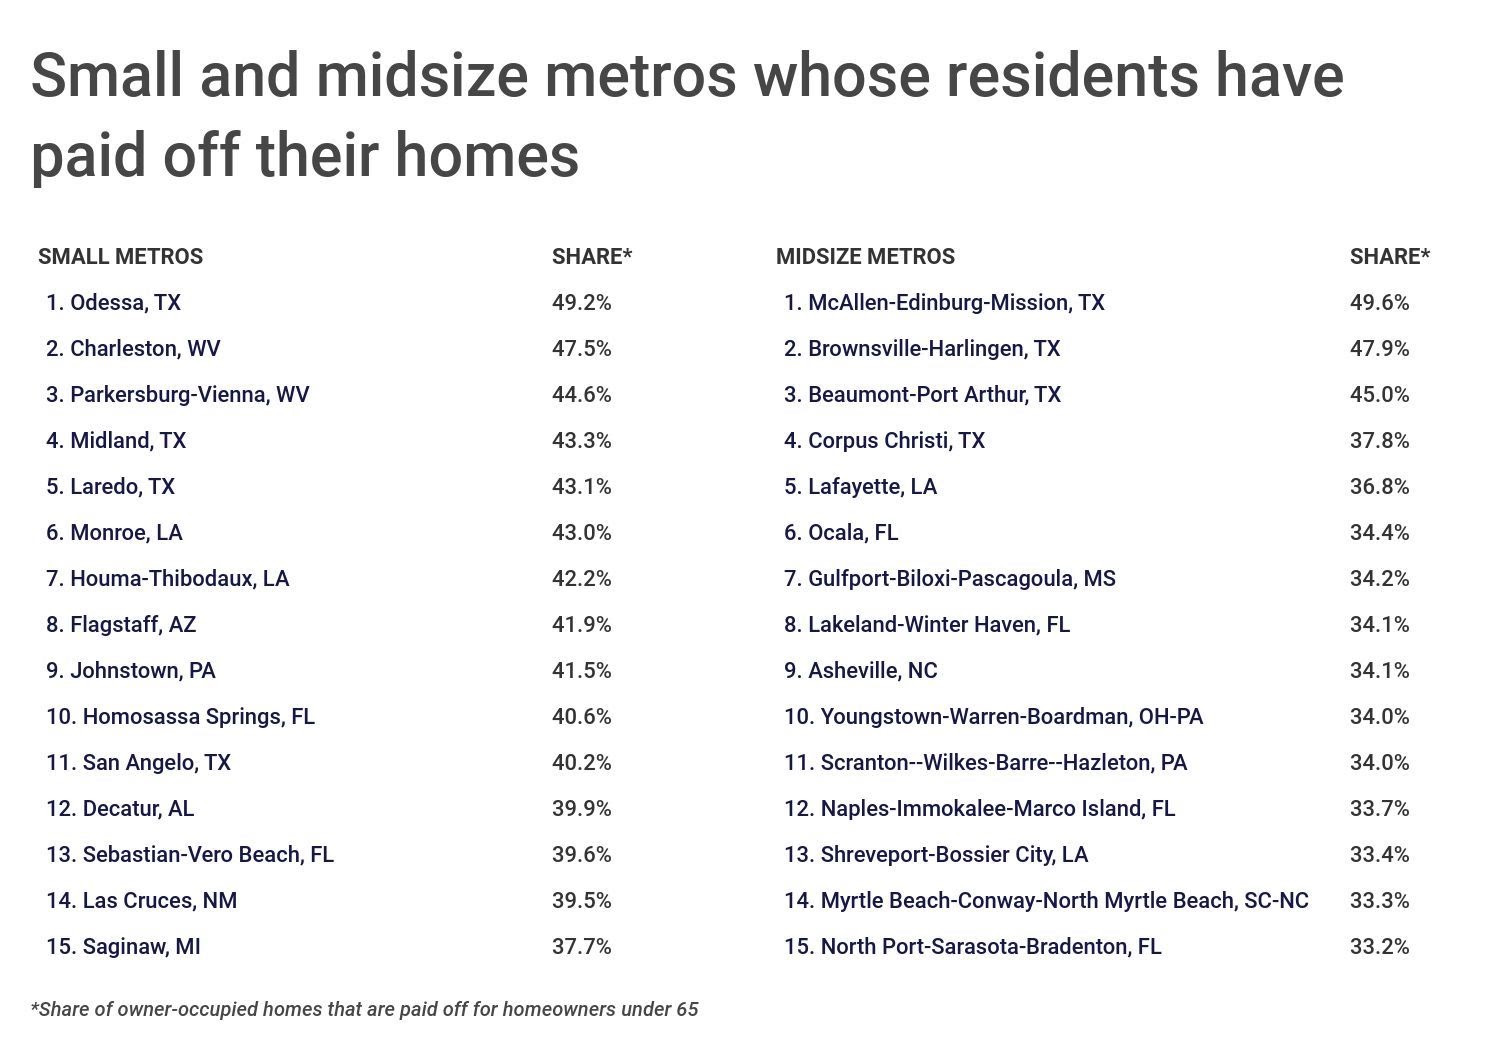
Here are the metropolitan areas with the largest share of residents who have paid off their homes.
Large Metros With the Most Mortgage-Free Homeowners

Photo Credit: Alamy Stock Photo
15. Memphis, TN-MS-AR
- Share of owner-occupied homes that are paid off: 25.4%
- Median home value: $135,000 (w/o mortgage), $175,000 (w/ mortgage)
- Median household income: $57,100 (w/o mortgage), $85,000 (w/ mortgage)
- Median monthly housing costs: $476 (w/o mortgage), $1,330 (w/ mortgage)
- Housing costs as a share of income: 9.5% (w/o mortgage), 18.8% (w/ mortgage)

Photo Credit: Alamy Stock Photo
14. Tucson, AZ
- Share of owner-occupied homes that are paid off: 26.1%
- Median home value: $175,000 (w/o mortgage), $195,000 (w/ mortgage)
- Median household income: $60,000 (w/o mortgage), $85,000 (w/ mortgage)
- Median monthly housing costs: $438 (w/o mortgage), $1,330 (w/ mortgage)
- Housing costs as a share of income: 8.2% (w/o mortgage), 19.2% (w/ mortgage)
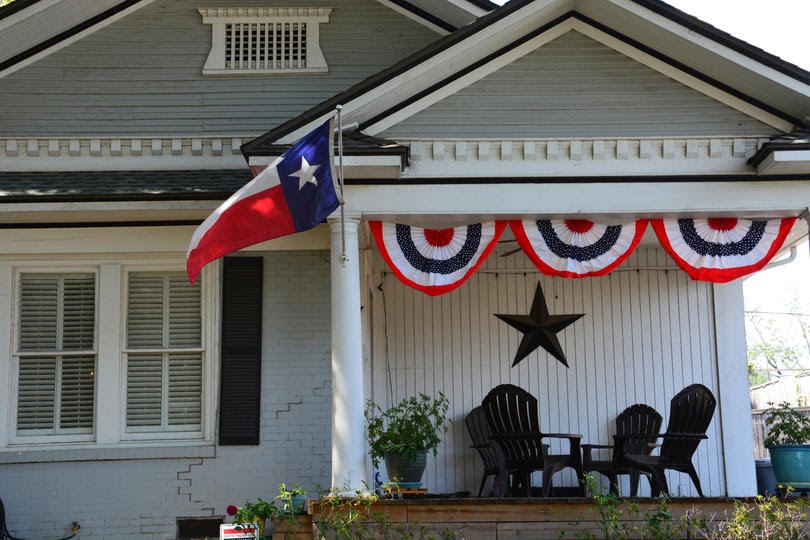
Photo Credit: Alamy Stock Photo
13. Dallas-Fort Worth-Arlington, TX
- Share of owner-occupied homes that are paid off: 26.2%
- Median home value: $180,000 (w/o mortgage), $250,000 (w/ mortgage)
- Median household income: $81,000 (w/o mortgage), $110,000 (w/ mortgage)
- Median monthly housing costs: $691 (w/o mortgage), $1,838 (w/ mortgage)
- Housing costs as a share of income: 9.7% (w/o mortgage), 20.2% (w/ mortgage)

Photo Credit: Alamy Stock Photo
12. Cleveland-Elyria, OH
- Share of owner-occupied homes that are paid off: 26.5%
- Median home value: $130,000 (w/o mortgage), $160,000 (w/ mortgage)
- Median household income: $75,000 (w/o mortgage), $94,030 (w/ mortgage)
- Median monthly housing costs: $576 (w/o mortgage), $1,343 (w/ mortgage)
- Housing costs as a share of income: 9.2% (w/o mortgage), 17.6% (w/ mortgage)

Photo Credit: Alamy Stock Photo
11. Rochester, NY
- Share of owner-occupied homes that are paid off: 26.8%
- Median home value: $135,000 (w/o mortgage), $150,000 (w/ mortgage)
- Median household income: $68,600 (w/o mortgage), $95,000 (w/ mortgage)
- Median monthly housing costs: $613 (w/o mortgage), $1,400 (w/ mortgage)
- Housing costs as a share of income: 10.4% (w/o mortgage), 18.1% (w/ mortgage)

Photo Credit: Alamy Stock Photo
10. Oklahoma City, OK
- Share of owner-occupied homes that are paid off: 28.2%
- Median home value: $110,000 (w/o mortgage), $170,000 (w/ mortgage)
- Median household income: $56,000 (w/o mortgage), $89,210 (w/ mortgage)
- Median monthly housing costs: $427 (w/o mortgage), $1,363 (w/ mortgage)
- Housing costs as a share of income: 8.3% (w/o mortgage), 18.5% (w/ mortgage)

Photo Credit: Alamy Stock Photo
9. Tampa-St. Petersburg-Clearwater, FL
- Share of owner-occupied homes that are paid off: 28.2%
- Median home value: $170,000 (w/o mortgage), $230,000 (w/ mortgage)
- Median household income: $56,000 (w/o mortgage), $92,000 (w/ mortgage)
- Median monthly housing costs: $465 (w/o mortgage), $1,492 (w/ mortgage)
- Housing costs as a share of income: 9.0% (w/o mortgage), 19.7% (w/ mortgage)
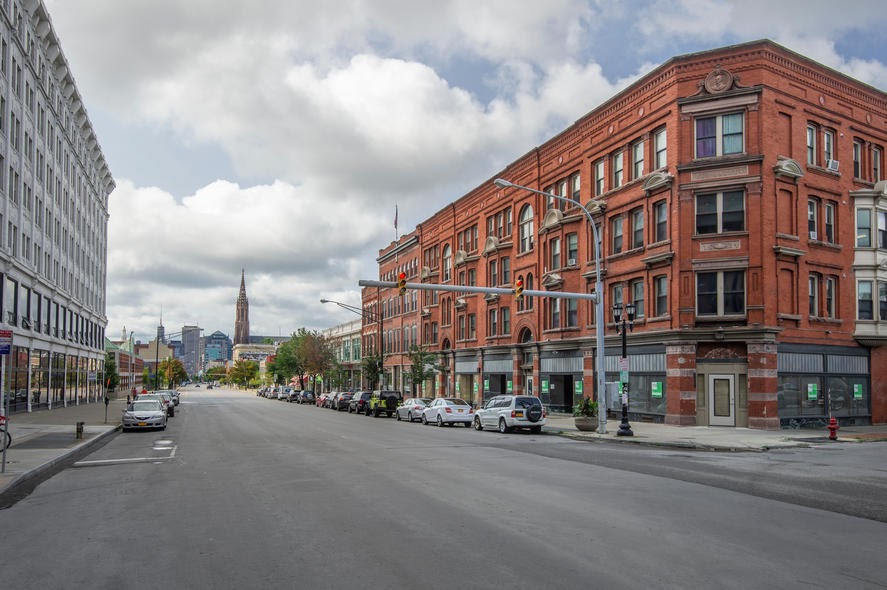
Photo Credit: Alamy Stock Photo
8. Buffalo-Cheektowaga-Niagara Falls, NY
- Share of owner-occupied homes that are paid off: 28.8%
- Median home value: $135,000 (w/o mortgage), $160,000 (w/ mortgage)
- Median household income: $72,000 (w/o mortgage), $95,000 (w/ mortgage)
- Median monthly housing costs: $553 (w/o mortgage), $1,348 (w/ mortgage)
- Housing costs as a share of income: 9.3% (w/o mortgage), 17.5% (w/ mortgage)

Photo Credit: Alamy Stock Photo
7. Pittsburgh, PA
- Share of owner-occupied homes that are paid off: 28.9%
- Median home value: $140,000 (w/o mortgage), $175,000 (w/ mortgage)
- Median household income: $69,000 (w/o mortgage), $98,000 (w/ mortgage)
- Median monthly housing costs: $528 (w/o mortgage), $1,338 (w/ mortgage)
- Housing costs as a share of income: 8.8% (w/o mortgage), 17.1% (w/ mortgage)

Photo Credit: Alamy Stock Photo
6. Birmingham-Hoover, AL
- Share of owner-occupied homes that are paid off: 29.0%
- Median home value: $111,000 (w/o mortgage), $180,000 (w/ mortgage)
- Median household income: $53,930 (w/o mortgage), $90,000 (w/ mortgage)
- Median monthly housing costs: $369 (w/o mortgage), $1,296 (w/ mortgage)
- Housing costs as a share of income: 8.2% (w/o mortgage), 17.9% (w/ mortgage)
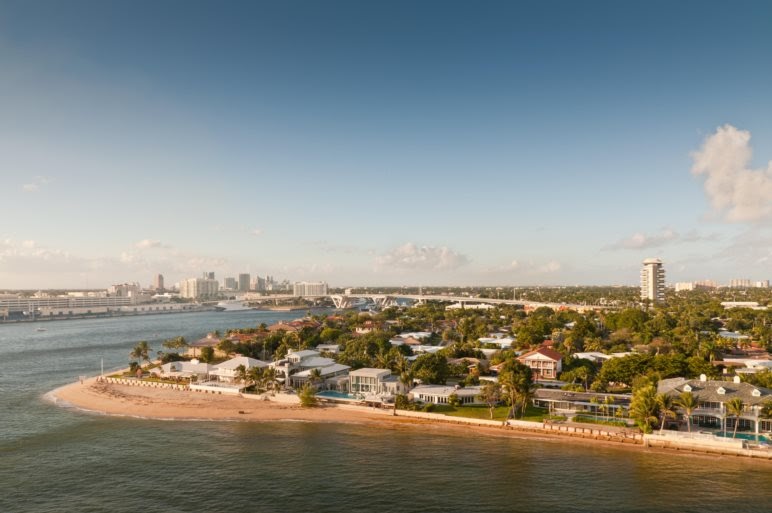
Photo Credit: Alamy Stock Photo
5. Miami-Fort Lauderdale-West Palm Beach, FL
- Share of owner-occupied homes that are paid off: 29.6%
- Median home value: $270,000 (w/o mortgage), $300,000 (w/ mortgage)
- Median household income: $65,000 (w/o mortgage), $93,000 (w/ mortgage)
- Median monthly housing costs: $659 (w/o mortgage), $1,905 (w/ mortgage)
- Housing costs as a share of income: 11.3% (w/o mortgage), 23.8% (w/ mortgage)

Photo Credit: Alamy Stock Photo
4. San Antonio-New Braunfels, TX
- Share of owner-occupied homes that are paid off: 30.1%
- Median home value: $130,000 (w/o mortgage), $195,000 (w/ mortgage)
- Median household income: $60,000 (w/o mortgage), $89,500 (w/ mortgage)
- Median monthly housing costs: $519 (w/o mortgage), $1,500 (w/ mortgage)
- Housing costs as a share of income: 9.8% (w/o mortgage), 20.4% (w/ mortgage)
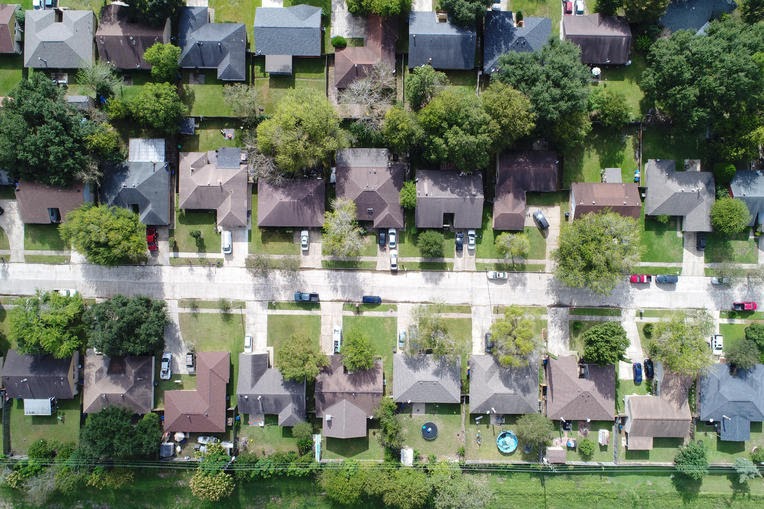
Photo Credit: Alamy Stock Photo
3. Houston-The Woodlands-Sugar Land, TX
- Share of owner-occupied homes that are paid off: 30.5%
- Median home value: $160,000 (w/o mortgage), $220,000 (w/ mortgage)
- Median household income: $75,000 (w/o mortgage), $110,000 (w/ mortgage)
- Median monthly housing costs: $614 (w/o mortgage), $1,788 (w/ mortgage)
- Housing costs as a share of income: 9.3% (w/o mortgage), 20.0% (w/ mortgage)

Photo Credit: Alamy Stock Photo
2. Detroit-Warren-Dearborn, MI
- Share of owner-occupied homes that are paid off: 30.6%
- Median home value: $120,000 (w/o mortgage), $200,000 (w/ mortgage)
- Median household income: $55,200 (w/o mortgage), $100,000 (w/ mortgage)
- Median monthly housing costs: $538 (w/o mortgage), $1,454 (w/ mortgage)
- Housing costs as a share of income: 10.8% (w/o mortgage), 17.7% (w/ mortgage)

Photo Credit: Alamy Stock Photo
1. New Orleans-Metairie, LA
- Share of owner-occupied homes that are paid off: 32.5%
- Median home value: $175,000 (w/o mortgage), $215,000 (w/ mortgage)
- Median household income: $60,000 (w/o mortgage), $90,000 (w/ mortgage)
- Median monthly housing costs: $411 (w/o mortgage), $1,491 (w/ mortgage)
- Housing costs as a share of income: 8.3% (w/o mortgage), 20.0% (w/ mortgage)
Detailed Findings & Methodology
The metros with the largest shares of residents who have paid off their homes tend to be places with lower home values that are cheaper to live in. Across these metros, homeowners who have paid off their mortgages also have lower median household incomes and monthly housing costs. For those who have paid off their mortgages, housing costs as a percentage of income are substantially lower than for households with a mortgage.
During the current economic downturn, homeowners with mortgages are more vulnerable financially. While many lower income homeowners have paid off their mortgages, those who have not are at particular risk. Many of the millions who have lost their jobs work in the hospitality and retail sectors and will struggle to float a mortgage without a consistent income.
To determine the metros where the most residents have paid off their homes, researchers at Construction Coverage analyzed the latest data from the U.S. Census Bureau’s 2018 American Community Survey Public Use Microdata Sample (ACS PUMS). Using ACS PUMS data, the researchers ranked metro areas according to the share of owner-occupied homes that are paid off. In the event of a tie, the metro with the larger number of owner-occupied homes that are paid off was ranked higher. Researchers also calculated the median home value, median household income, median monthly housing costs, and housing costs as a percentage of income for households both with and without a mortgage. Only households with homeowners under age 65 and metropolitan areas with at least 100,000 people were included in the analysis.
* This article was originally published here
HELP STOP THE SPREAD OF FAKE NEWS!
SHARE our articles and like our Facebook page and follow us on Twitter!


0 Comments