

Earning a six-figure income is a goal for many Americans, but few actually achieve it. According to data from the U.S. Bureau of Labor Statistics (BLS), less than 7 percent of American workers are employed in occupations paying a median salary of $100,000 or more. However, in some parts of the country, earning six figures is practically a requirement to live comfortably.
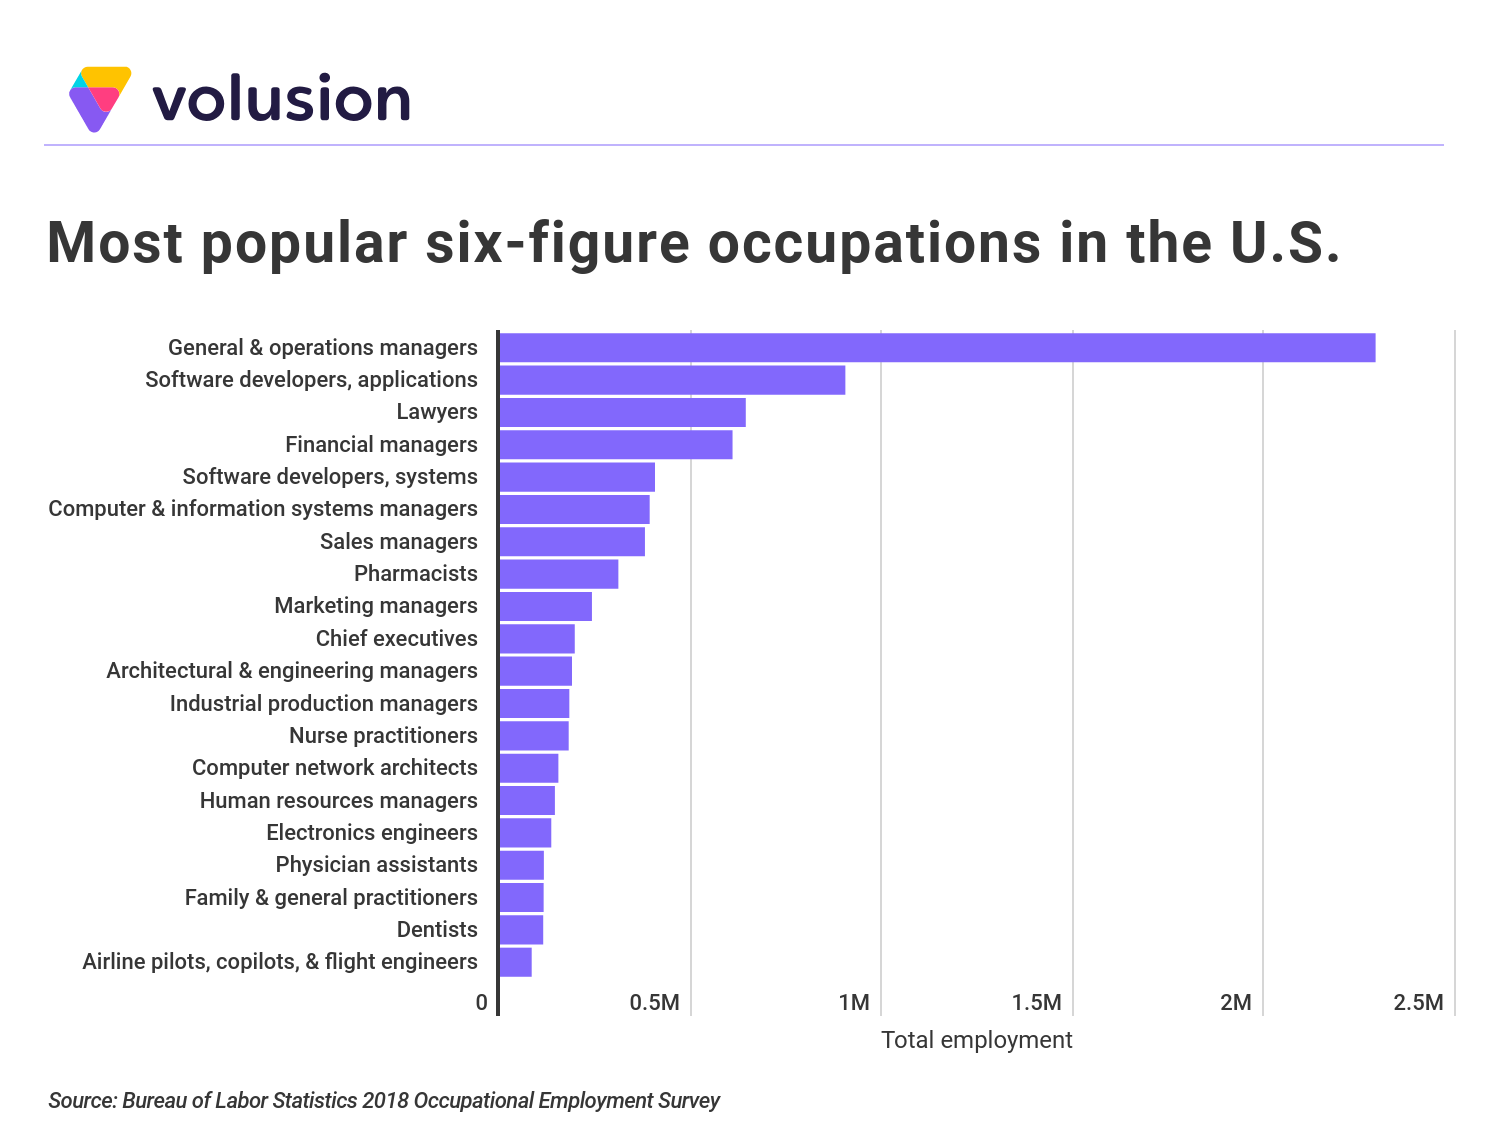
While the median earnings across all occupations in the U.S. is $38,640, some occupations pay far more. Nationally, general and operations managers are among the most popular occupations with median annual earnings over $100,000. Nearly 2.3 million American employees work as general and operations managers. Other six-figure jobs employing large numbers of Americans include tech jobs (software developers and computer and information systems managers) and jobs in the healthcare industry (pharmacists, nurse practitioners, and physician assistants).
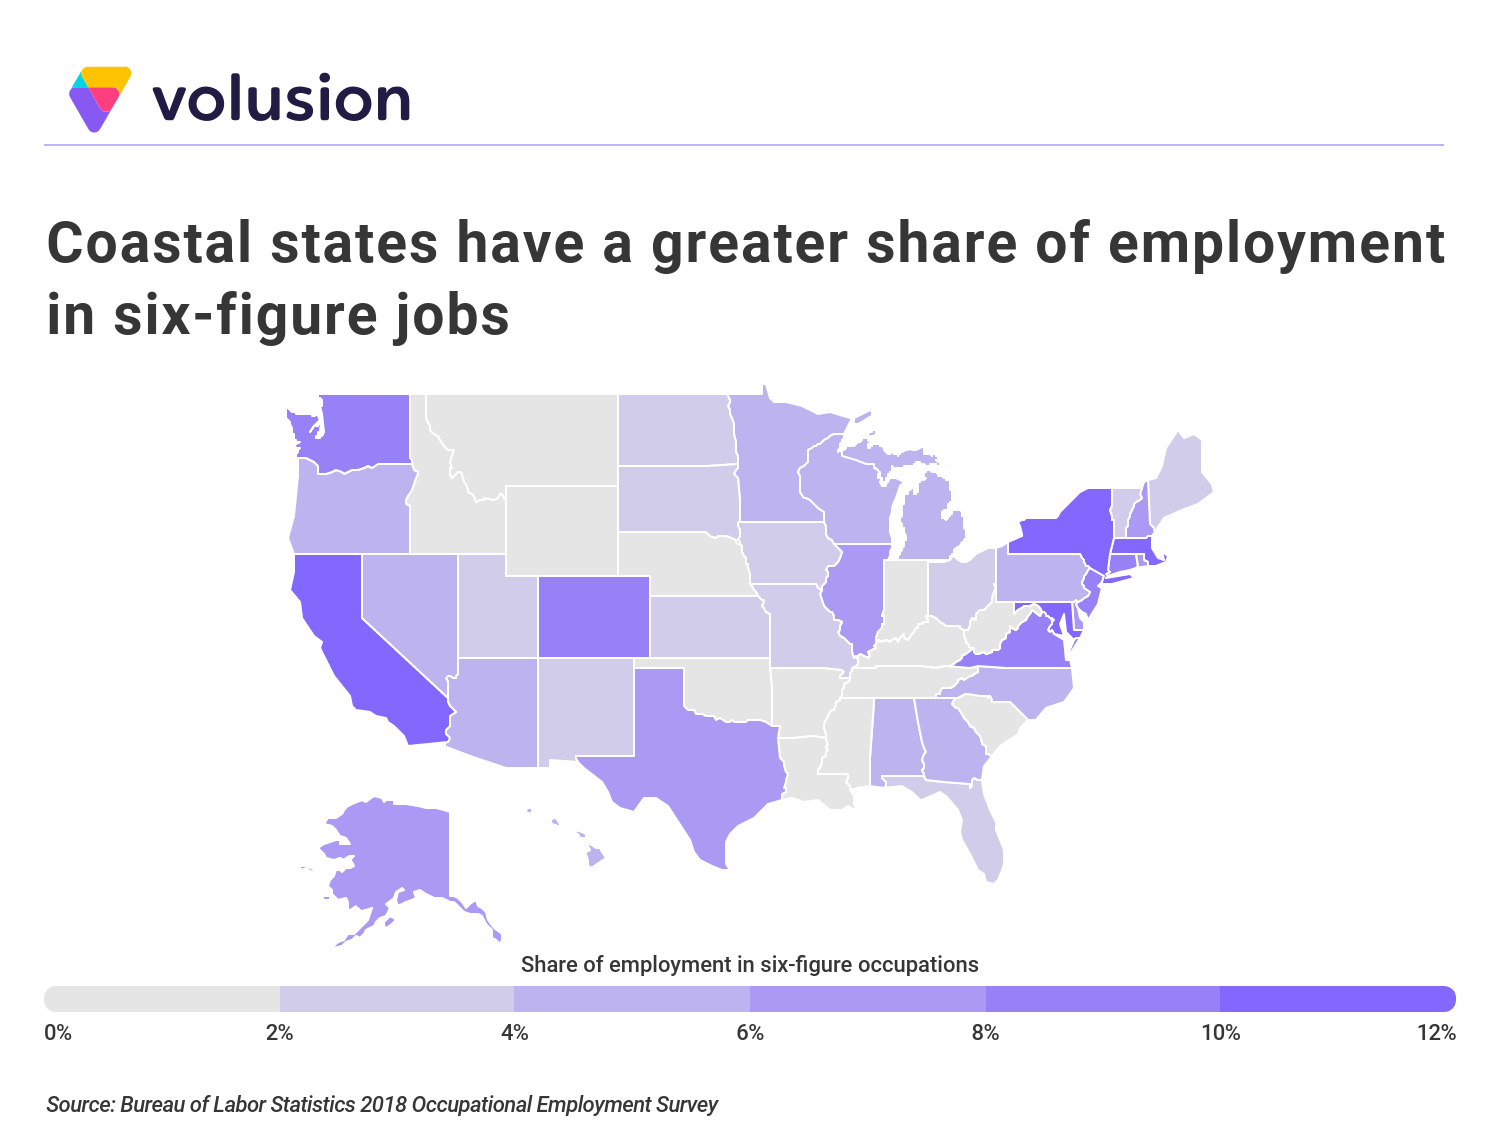
At the regional level, coastal states with higher costs of living tend to have more six-figure earners. Of all 50 states, California boasts the highest proportion of employees working in occupations with median earnings over $100,000, at 12.7 percent. Massachusetts and Maryland are close behind, with 12.2 percent and 11.9 percent, respectively. By contrast, Mississippi and Louisiana have the lowest share of six-figure earners in the country, with both states coming in at just over 1 percent.
To determine the U.S. metropolitan areas with the most six-figure occupations, researchers at Volusion analyzed data from the U.S. Bureau of Labor Statistics. Metros were ranked according to the share of employment in six-figure occupations—occupations with median annual earnings of $100,000 or greater. The researchers also calculated the percentage change in six-figure employment from 2015 to 2018, the total employment in six-figure occupations, the median annual wage across all occupations, the most over-indexed six-figure occupation, and the highest-paying six-figure occupation(s). The most over-indexed six-figure occupation for each metro was determined as the occupation that has the greatest difference in employment share when compared to that occupation at the national-level.
Only metropolitan areas with at least 100,000 people were included in the analysis. Additionally, metro areas were grouped into the following cohorts based on population size:
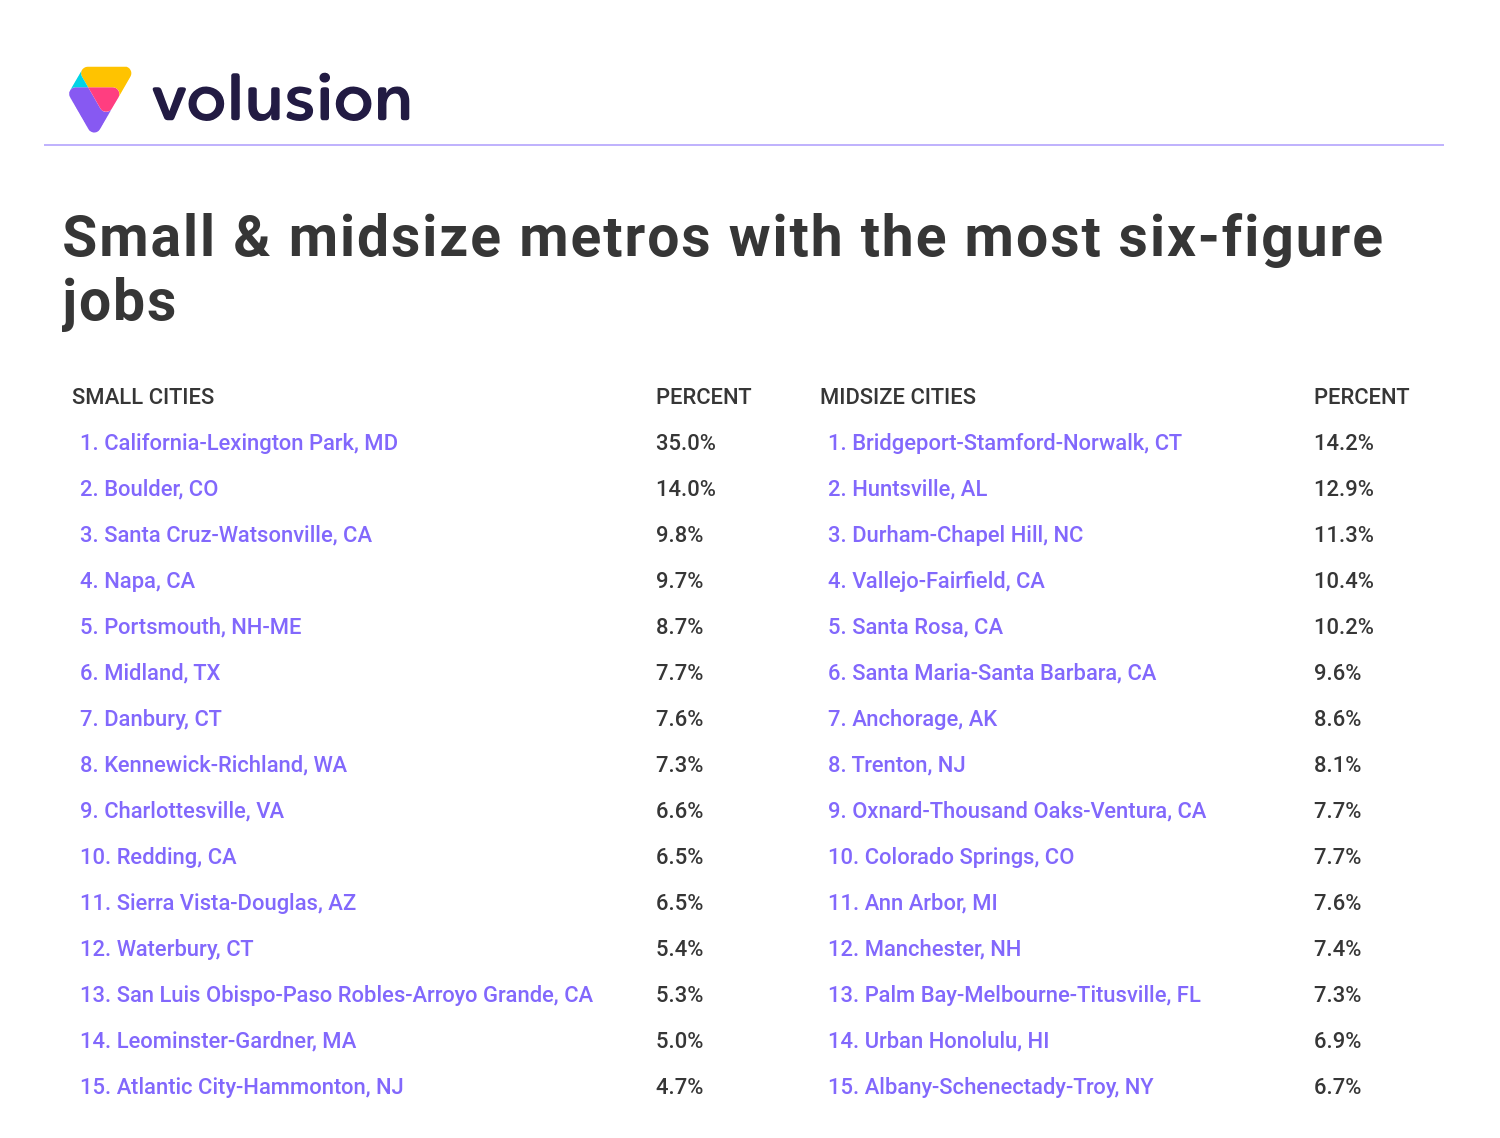
- Small metros: 100,000-350,000
- Midsize metros: 350,000-1,000,000
- Large metros: more than 1,000,000
Here are the large metros with the most six-figure occupations.
The Top 10 Large Metros With the Most Six-figure Jobs

Photo Credit: Alamy Stock Photo
10. Los Angeles-Long Beach-Anaheim, CA
- Share of employment in six-figure occupations: 10.1%
- Percent change in six-figure employment (2015-2018): 31.9%
- Total employment in six-figure occupations: 614,060
- Median annual wage across all occupations: $40,970
- Most over-indexed six-figure occupation: Producers and Directors
- Highest-paying six-figure occupation: Chief Executives; Oral and Maxillofacial Surgeons; Anesthesiologists; Psychiatrists
While the LA metro’s overall median annual wage is the lowest on this list, more than 10 percent of the LA metro area’s employees work in occupations with six-figure median wages. Los Angeles had a notable increase in six-figure employment from 2015 to 2018, at 31.9 percent. Producer and director is the most over-indexed six-figure occupation, which is not surprising given the prominence of the metro’s entertainment industry.

Photo Credit: Alamy Stock Photo
9. San Diego-Carlsbad, CA
- Share of employment in six-figure occupations: 10.2%
- Percent change in six-figure employment (2015-2018): 19.3%
- Total employment in six-figure occupations: 145,100
- Median annual wage across all occupations: $43,390
- Most over-indexed six-figure occupation: Electronics Engineers, Except Computer
- Highest-paying six-figure occupation: Chief Executives; Internists; Obstetricians and Gynecologists; Pediatricians; Psychiatrists; Surgeons
More than 145,000 residents work in six-figure jobs in San Diego, helping to offset the metro’s notoriously high cost of living. The tech industry is prominent in San Diego, and electronics engineers are over-represented when compared to the country as a whole. While the number of workers employed in six-figure jobs is increasing in San Diego (19.3 percent from 2015 to 2018), the increase is below the national average.

Photo Credit: Alamy Stock Photo
8. Sacramento–Roseville–Arden-Arcade, CA
- Share of employment in six-figure occupations: 10.8%
- Percent change in six-figure employment (2015-2018): 73.0%
- Total employment in six-figure occupations: 103,650
- Median annual wage across all occupations: $42,950
- Most over-indexed six-figure occupation: Environmental Engineers
- Highest-paying six-figure occupation: Orthodontists; Family and General Practitioners; Obstetricians and Gynecologists; Pediatricians; Psychiatrists; Surgeons; Nurse Anesthetists
The Sacramento metro area experienced a 73 percent increase in six-figure employment from 2015 to 2018. As the capital of California, the public administration sector plays a major role in the Sacramento economy. The area is also targeting clean technology and energy for economic development, which is reflected in the metro’s most over-indexed six-figure occupation—environmental engineers.

Photo Credit: Alamy Stock Photo
7. Hartford-West Hartford-East Hartford, CT
- Share of employment in six-figure occupations: 11.1%
- Percent change in six-figure employment (2015-2018): 21.5%
- Total employment in six-figure occupations: 62,440
- Median annual wage across all occupations: $48,820
- Most over-indexed six-figure occupation: Actuaries
- Highest-paying six-figure occupation: Family and General Practitioners; Internists; Obstetricians and Gynecologists; Psychiatrists; Surgeons
Over 11 percent of employees in the Hartford metro area work in six-figure jobs. Known as the “Insurance Capital of the World,” Hartford is home to seven major insurance firms, including Aetna, Travelers, and CIGNA. The insurance industry makes Hartford a good place to find work as an actuary, the area’s most over-indexed six-figure occupation.

Photo Credit: Alamy Stock Photo
6. New York-Newark-Jersey City, NY-NJ-PA
- Share of employment in six-figure occupations: 12.6%
- Percent change in six-figure employment (2015-2018): 27.3%
- Total employment in six-figure occupations: 1,196,400
- Median annual wage across all occupations: $47,080
- Most over-indexed six-figure occupation: Advertising and Promotions Managers
- Highest-paying six-figure occupation: Chief Executives; Oral and Maxillofacial Surgeons; Orthodontists; Anesthesiologists; Obstetricians and Gynecologists; Surgeons
The most populous metro area in the U.S., New York is known for being an expensive place to live. Therefore, it’s not surprising that the median annual wage across all occupations is higher than the national median, and the share of employees in six-figure jobs is almost twice the national average of 6.7 percent.

Photo Credit: Alamy Stock Photo
5. Seattle-Tacoma-Bellevue, WA
- Share of employment in six-figure occupations: 13.1%
- Percent change in six-figure employment (2015-2018): 21.2%
- Total employment in six-figure occupations: 252,680
- Median annual wage across all occupations: $50,860
- Most over-indexed six-figure occupation: Software Developers, Applications
- Highest-paying six-figure occupation: Chief Executives; Oral and Maxillofacial Surgeons; Anesthesiologists; Family and General Practitioners; Internists; Obstetricians and Gynecologists; Psychiatrists; Surgeons; Airline Pilots, Copilots, and Flight Engineers
The Seattle metro area is known for more than coffee and rainy weather. This tech hub also boasts a high proportion of employees working in six-figure occupations, at 13.1 percent. With major tech headquarters such as Amazon and Microsoft located in the Seattle area, it is not surprising that software developers are prominent.

Photo Credit: Alamy Stock Photo
4. Boston-Cambridge-Nashua, MA-NH
- Share of employment in six-figure occupations: 14.0%
- Percent change in six-figure employment (2015-2018): 24.5%
- Total employment in six-figure occupations: 381,450
- Median annual wage across all occupations: $51,510
- Most over-indexed six-figure occupation: Biochemists and Biophysicists
- Highest-paying six-figure occupation: Chief Executives; Oral and Maxillofacial Surgeons; Orthodontists; Anesthesiologists; Internists; Obstetricians and Gynecologists; Surgeons
Several of the top universities in the world (including Harvard and MIT) are located in the Boston metro area. Buoyed by these top research institutions and world-class research hospitals, Boston’s biotech industry is booming. The share of workers in six-figure jobs is also growing, with a 24.5 percent increase from 2015 to 2018.

Photo Credit: Alamy Stock Photo
3. San Francisco-Oakland-Hayward, CA
- Share of employment in six-figure occupations: 20.9%
- Percent change in six-figure employment (2015-2018): 24.4%
- Total employment in six-figure occupations: 495,690
- Median annual wage across all occupations: $54,090
- Most over-indexed six-figure occupation: Sociologists
- Highest-paying six-figure occupation: Chief Executives; Anesthesiologists; Family and General Practitioners; Internists; Psychiatrists; Surgeons; Nurse Anesthetists; Airline Pilots, Copilots, and Flight Engineers
With an increase of 24.4 percent from 2015 to 2018, the San Francisco metro has seen significant growth in the number of people working in six-figure occupations. Although San Francisco is known for its tech industry, the most over-indexed six-figure occupation is not in a tech field at all. In fact, sociologists are the most over-indexed occupation. Notably, the San Francisco metro area is home to several universities that attract workers in this field.

Photo Credit: Alamy Stock Photo
2. Washington-Arlington-Alexandria, DC-VA-MD-WV
- Share of employment in six-figure occupations: 20.9%
- Percent change in six-figure employment (2015-2018): 37.7%
- Total employment in six-figure occupations: 650,270
- Median annual wage across all occupations: $54,680
- Most over-indexed six-figure occupation: Political Scientists
- Highest-paying six-figure occupation: Chief Executives; Oral and Maxillofacial Surgeons; Orthodontists; Psychiatrists; Surgeons
Over one-fifth of the metro area’s employees work in six-figure occupations, a figure that increased by 37.7 percent from 2015. Many of these workers—including an above-average number of political scientists—are either employed by or do business with the federal government.
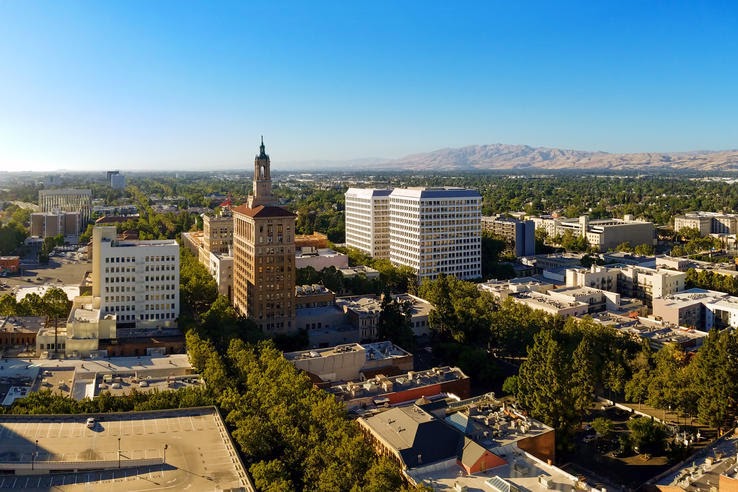
Photo Credit: Alamy Stock Photo
1. San Jose-Sunnyvale-Santa Clara, CA
- Share of employment in six-figure occupations: 28.2%
- Percent change in six-figure employment (2015-2018): 0.1%
- Total employment in six-figure occupations: 300,800
- Median annual wage across all occupations: $60,110
- Most over-indexed six-figure occupation: Computer Hardware Engineers
- Highest-paying six-figure occupation: Chief Executives; Obstetricians and Gynecologists; Psychiatrists; Surgeons
Situated in the heart of Silicon Valley, the San Jose metro area has a large share of well-paying jobs. Over 28 percent of the area’s employees work in six-figure occupations, and the median wage across all occupations is the highest of all large metros at $60,110. Silicon Valley is one of the biggest technology hubs in the world, and indeed, computer hardware engineers are over-represented in the workforce.
Detailed Findings & Methodology
To find the metropolitan areas with the most six-figure occupations, Volusion analyzed data from the Bureau of Labor Statistics’ 2015 and 2018 Occupational Employment Survey. The share of employment in six-figure occupations was measured as the percentage of employees working in occupations with a median annual wage of $100,000 or more. The percent change in six-figure employment from 2015 to 2018 was calculated as the percentage change in the number of employees in a metro working in occupations with a median annual wage of $100,000 or more from 2015 to 2018.
The most over-indexed six-figure occupation for each metro was determined as the occupation that has the greatest difference in employment share when compared to that occupation at the national-level. For example, when comparing software developers in the Seattle metro area to software developers nationally, the percentage of employees working as software developers in Seattle is more than double the national percentage.
The highest-paying six-figure occupation is the occupation with the highest median annual wage. The BLS does not report specific median wage values that exceed $208,000. Because of that, certain metros have multiple highest-paying six-figure occupations listed that all exceed $208,000. Metro areas are ranked by the share of employment in six-figure occupations.
Only metropolitan areas with at least 100,000 people were included in the analysis. Additionally, metro areas were grouped into the following cohorts based on population size:
- Small metros: 100,000-350,000
- Midsize metros: 350,000-1,000,000
- Large metros: more than 1,000,000
The metros with the most six-figure jobs tend to have high costs of living as well as high median wages across all occupations. Tech hubs (San Jose, San Francisco, Seattle) feature prominently in the top 10 as do metros with highly educated workforces (for example, Washington, D.C. and Boston). The majority of metros with the most six-figure occupations also experienced large increases in the number of people employed in six-figure jobs between 2015 and 2018.
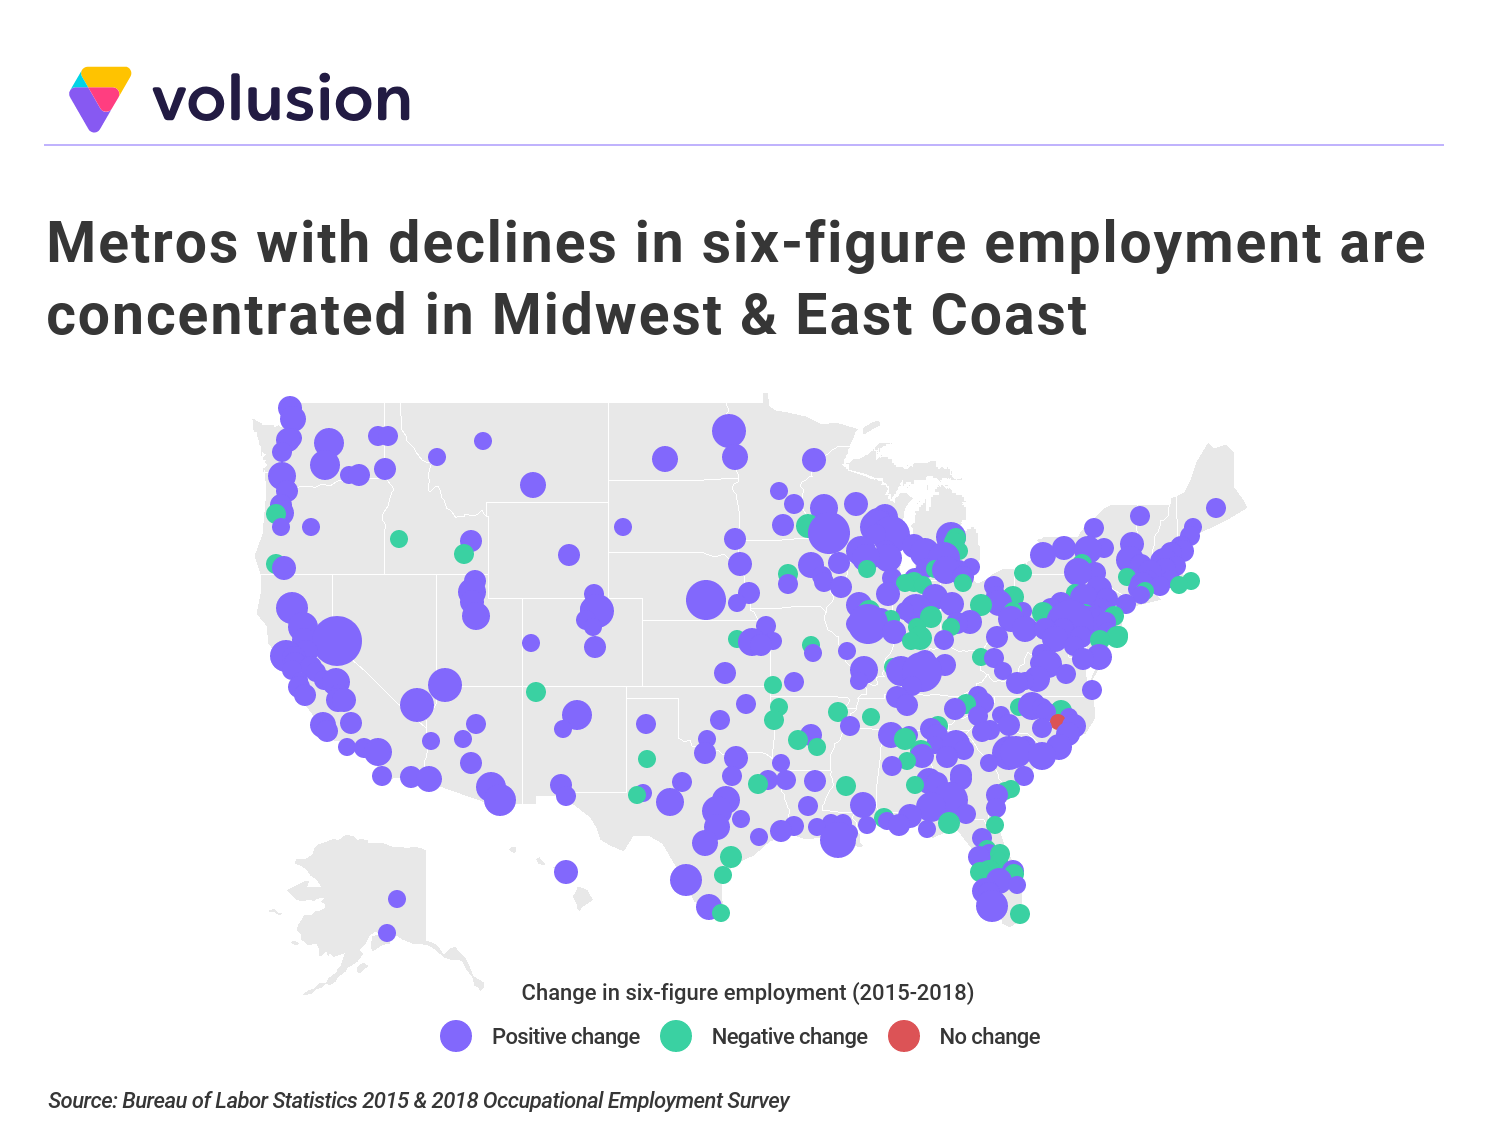
Across the country, a diverse set of metros had large increases in their six-figure employment from 2015 to 2018, and many others had more nominal increases. Nationwide, the percent change in six-figure employment from 2015-2018 was 84.6 percent. While nearly 80 percent of all metros analyzed had an increase in six-figure employment, many metros on the East Coast and in the Midwest had a decline in six-figure employment. With high-paying healthcare occupations projected to grow 14 percent from 2018 to 2028, the change in six-figure employment will likely accelerate even more in the near future.
– The Center Square
* This article was originally published here
HELP STOP THE SPREAD OF FAKE NEWS!
SHARE our articles and like our Facebook page and follow us on Twitter:


0 Comments